First growth hacker

running rapid experiments to find the levers worth scaling — then handing them to product and growth to deploy.

As BitMart's first growth hacker hire, I led an experimentation team — 20+ rapid experiments to validate which levers actually move retention, an AI-driven workflow that compressed cycle time from few weeks to under a week, and 5 validated growth models handed off to product and growth teams to scale.

project
BitMart
role
Growth Hacker Lead
year
OCT 2025 – FEB 2026
team
3, built from solo
growth model ROI
0%
validated across 5 growth models
cycle compression
0%
few weeks → under a week per experiment
dashboard build
0days
internal dashboard, originally estimated at 1 month

Defining the growth hacker role at BitMart

BitMart already had a growth team and a product team. What it didn't have was a dedicated experimentation function — someone whose job was to test growth hypotheses fast, validate which levers actually move activation and retention, then hand the proven ones back for the operating teams to scale. I joined as the first growth hacker to build that function — with no experiment platform, no A/B framework, no dashboard, and a deliverable that wasn't campaigns but validated growth models.

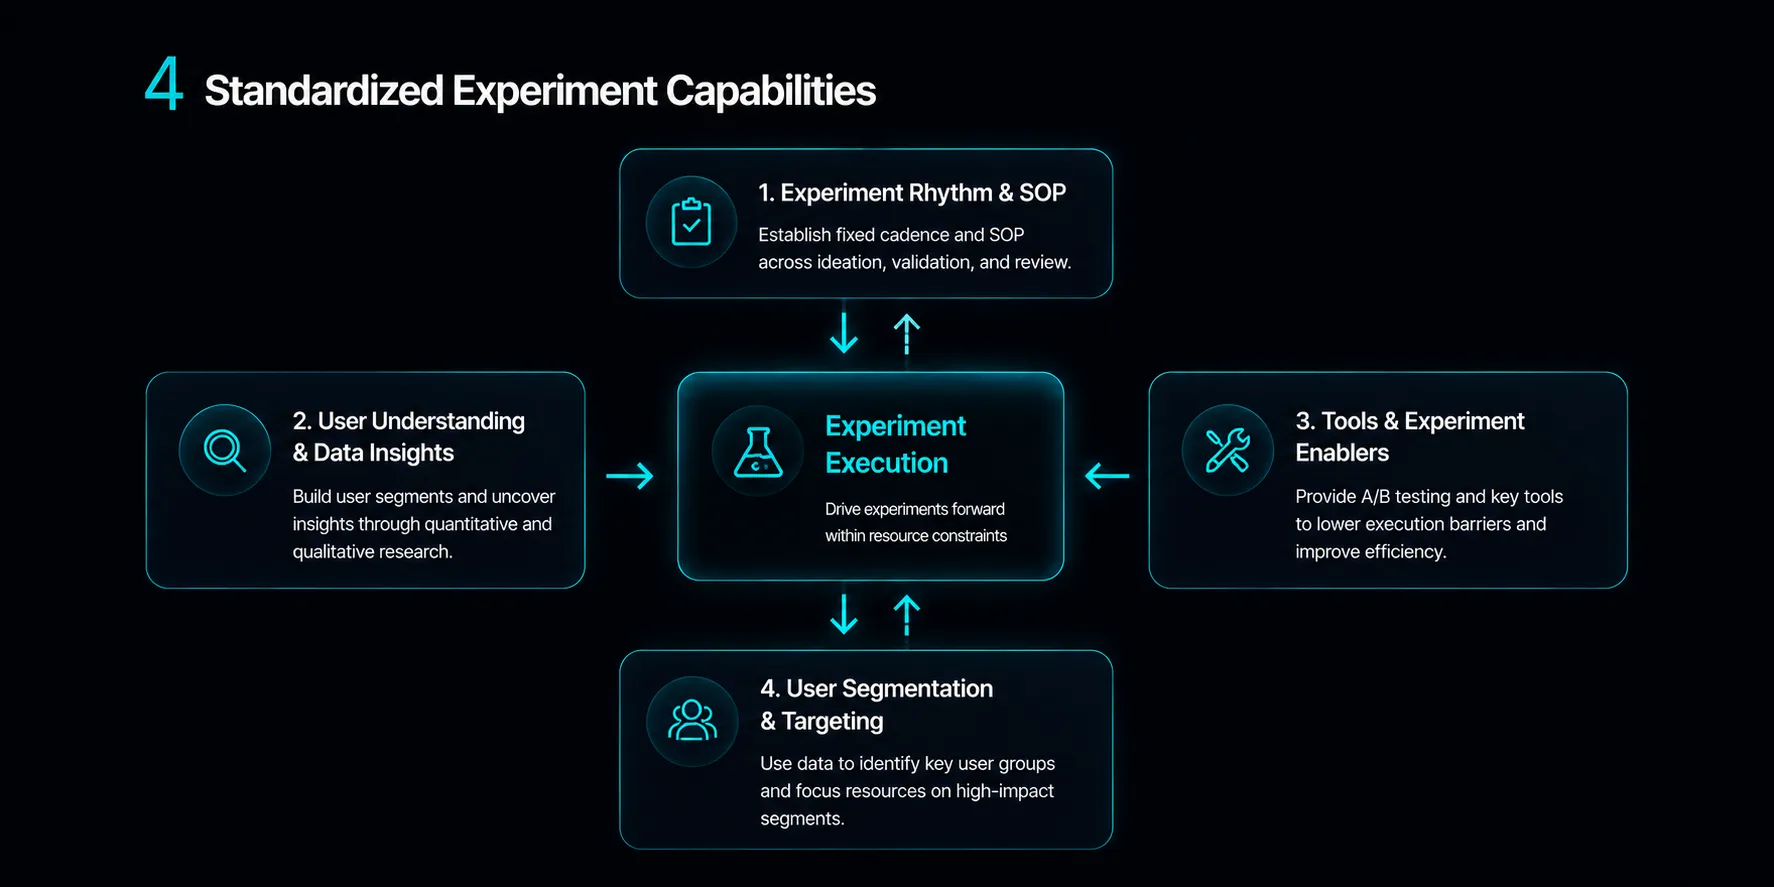
Before designing experiments, I spent the first weeks running 1-on-1s across product, growth, and operations teams, and shipping a foundational user survey to understand who BitMart's users actually were. The output wasn't a number to report — it was the user segmentation that anchored every experiment that followed: new users, active users, and at-risk-of-churning users.

The function started as one person. I led the strategy while running execution myself, and the supporting roles I needed — engineering, operations, product coordination, analyst support — all sat in other teams. None of them reported to me. Shipping experiments meant building cross-functional influence, not headcount. As the cadence proved its value, full-time hires joined and the function grew into a small dedicated team.

Solo execution, cross-functional management
  • Hats I wore at the start: Team Lead, UX Designer, UI and Visual Designer, Data Analyst — five roles, one person
  • Functions I coordinated without authority: Backend engineering, frontend development, product-team alignment, ad-hoc analyst support — none of them reported to me

Two tracks on one experiment cadence

Experiments fell into two categories. Some required product engineering — new screens, deeper integrations, UI changes touching the codebase. Others ran through operational levers — pop-ups, copy, incentives, email, push, in-app banners. Both tested the same underlying hypotheses; what differed was the deployment path.

I queued the product experiments into the product team's roadmap and ran the operational ones in parallel. The product track moved at the product team's cadence — designs delivered in November shipped between late January and March. The operational track delivered in days. Both generated evidence; both fed into the validated models that came later.

Why two tracks ran in parallel
  • Product track: Compounds into the product itself — permanent capability, slower deployment, deeper investment
  • Operational track: Validates fast — testable in days, easier to iterate, lower commitment
  • Combined: Kept the experiment pipeline moving at all times without waiting on a single dependency

AI as the connective tissue of every experiment

The traditional experiment workflow — PM brief → copywriter → translator → designer → analyst — takes few weeks minimum. With a 2-person team and no dedicated support, that math doesn't work. I redesigned the workflow with AI as the connective tissue across three layers.

Three AI layers
  • Ideation: AI analyzed user behavioral data, surfaced retention thresholds (3 / 7 / 12 trades), and generated experiment hypotheses
  • Execution: AI generated copy variants, translated into 11 languages, flagged tone and cultural issues — I reviewed and approved
  • Analysis: AI processed raw experiment data into structured reports and summary cards for the weekly sync

End-to-end: under a week per experiment, down from few weeks. 70% cycle compression on a stack that had zero baseline infrastructure to start from.

This wasn't AI as a tool. It was AI as the connective tissue of the workflow — from data signal to deployed experiment to shared insight.

3-layer AI workflow diagram

3-layer AI workflow — Ideation, Execution, Analysis replacing the old PM → copywriter → translator → designer → analyst chain

Weekly experiment rhythm

Beyond the per-experiment workflow, the team operated on a fixed weekly rhythm — Tuesday brainstorm, Thursday kickoff, Friday review. Cross-team coordination didn't depend on me chasing people; the rhythm itself did the chasing, and the SOP made every experiment feel routine rather than bespoke.

Weekly team experiment rhythm

Weekly experiment pattern — Tuesday brainstorm, Thursday kickoff, Friday review

Four standardized experiment capabilities

Beyond the weekly rhythm, four standardized capabilities became reusable infrastructure — experiment SOP, user data and observation, A/B tooling, and user segmentation focus. Each new experiment plugged into existing scaffolding instead of rebuilding it from scratch.

Four standardized experiment capabilities

The four standardized capabilities that supported every subsequent experiment

The dashboard, built in 3 days

Early on, tracking experiment performance meant manually pulling data from multiple sources and assembling it by hand. I built an internal dashboard integrating live exchange data with AI-assisted processing. Estimated build time by a data engineer: 1+ month. Actual: 3 days. Result: a growth-hacker-exclusive data dashboard, visible in real time.

BitMart growth hacker dashboard view 1

Dashboard view 1 — top-line activation and retention

BitMart growth hacker dashboard view 2

Dashboard view 2 — experiment cohort tracking

BitMart growth hacker dashboard view 3

Dashboard view 3 — funnel and segmentation breakdown

BitMart growth hacker dashboard view 4

Dashboard view 4 — switchable monthly / weekly cumulative views

1 / 4

5 validated growth models, up to 929% ROI

Across 4 months, the team ran 21 experiments. Five validated growth models came out of that work — each backed by clear retention or activation evidence, with peak ROI reaching 929%.

Five validated growth models overview

The five validated growth models — overview across new, active, and at-risk segments

Four of the strongest, with the data
  • Deposit funnel optimization: Clear reward framing + 50U threshold → +3.8pp first deposit on App, +2.7pp lift on the 50U threshold group
  • 3-trade threshold (activation magic number): Fee waiver for first 3 trades → +27pp trade conversion, T+7 retention +9.99pp, ROI 929%
  • Incentivizing early decisions: Higher incentive intensity beats lower threshold for new users → +6pp 24h deposit, +3.1pp 3-day deposit conversion
  • Loss-rebound model: Conditional compensation in short-time × high-loss × trade-capable segment → ROI 579% on users successfully reached
Deposit funnel optimization result

Deposit funnel optimization — clear reward framing + 50U threshold lifted first deposit

3-trade threshold result

3-trade threshold — trade conversion +27pp, T+7 retention +9.99pp, ROI 929%

Incentivizing early decisions result

Incentivizing early decisions — higher incentive intensity, +6pp 24h deposit, +3.1pp 3-day

Loss-rebound model segmentation

Loss-rebound model — ROI × T+7 retention map identifies scalable zones vs no-fly zones

Five validated models. Each backed by a hypothesis, a controlled experiment, and the data to defend it.

BitMart growth hacker — overview

From validated experiment to scaled feature

A growth hacker's job ends when the model is validated. The scale-up — turning a validated lever into a permanent product capability or a deployed growth campaign — belongs to the product and growth teams. Without that handoff, every experiment expires the moment the campaign ends.

When operational experiments showed clear results, I went directly to the relevant product owners, formalized the experiment design as a product brief, and pushed for it to enter the roadmap. The deposit funnel optimization and the 3-trade threshold both made it into the product. The full shipping cycle ran through the product team's own cadence — operational experiments validated in December, formalized into product briefs by January, shipped between January and March.

What goes back to whom
  • Growth team: Operational levers — pop-ups, push, email, incentive campaigns — continue at scale based on the validated models
  • Product team: Structural changes — deposit-flow UI, trade-threshold milestone, in-product rewards — formalize the validated mechanic into permanent behavior

Process is built. Scale isn't yet.

The system worked. Experiments ran faster, insights were sharper, and the team operated above its weight class. But two structural limits became clear — and they're the same limits I'd start by addressing if I were doing this again.

Dedicated data analyst

Experiment planning, sample sizing, anomaly detection, and scaling-risk assessment all rely on part-time data resources. That works at low volume. At higher cadence it becomes the bottleneck — both for experiment validity and for decision speed. The next hire would be a dedicated analyst, and it would change the cadence substantially.

Closing the experiment-to-product loop

In a CEX environment, growth experiments still don't graduate into product features cleanly. Conversion optimization and product evolution live in separate orgs with separate timelines. Even when an operational experiment proves a lever works, formalizing it into the product requires a separate negotiation. The next problem worth solving: a workflow where experiment insight → product decision → shipped feature happens inside one AI-driven system, not across three teams.